Junctions 9 Features

Junctions 9 is the latest version of TRL’s industry-standard package for the modelling of roundabout and priority intersections.

Junctions 9 consists of ARCADY 9 (the Roundabout Module), PICADY 9 (the Priority Intersection Module), and OSCADY 9 (the Signalised Intersection Module, available in Junctions 9.5 onwards).  These modules are sold and licensed separately.

Core Modelling Features

  • UK empirical models for roundabouts and priority junctions
  • Accident prediction for roundabouts and priority junctions
  • Geometric delay for roundabout and priority junctions
  • Signal evaluation and optimisation for signalised junctions
  • HCM 2010 models for roundabouts, TWSC and AWSC

Roundabout Geometry Measurement Tools

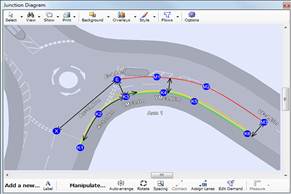
The junction diagram includes tools to help with the measurement of standard and mini-roundabout geometries, such as entry width, flare length, entry radius. These work by providing a set of control points and construction lines which can be dragged to coincide with the appropriate points on a background image or drawing of the junction. Junctions 9 uses these control points to calculate the ARCADY geometries which can then be automatically saved in the file.

Revised Mini-roundabout Model

Data from the original mini-roundabout model (first introduced in ARCADY 5) has been re-analysed and as a result a revised model is now available. In typical cases, this tends to predict slightly higher capacity. Data input is identical to previous versions.

Audit Trail

The Audit Trail system provides a way of tracking the version history of the file, which is especially useful for complex files or when a file is worked on by several people. Junctions 9 can optionally record each change made to the file, forming a log of all changes. The same system also allows users to manually enter the overall status of the file.

TEMPRO Growth Factors

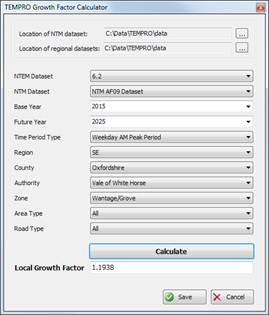
If TEMPRO datasets are installed, Junctions 9 can be used to calculate traffic growth factors.  Simply enter the base/future years, geographical area and other properties and J9 will read data directly from the TEMPRO datasets and produce a local growth factor which can then be automatically applied to Demand Set relationships.

Read Traffic Flows from Excel Spreadsheets

Junctions 9 can be set up to read traffic survey data direct from Excel spreadsheets. This works across demand sets and time segments, and can apply to turning counts and HV% information. Once set up, this provides a quick way to transfer demand data from Excel into J9 and can significantly reduce the required amount of data entry.

Improved Reporting

  • Faster report generation
  • Include X-Y and Time Graphs in Reports
  • The content of reports for basic files has been simplified.

User Interface Enhancements

  • Clear colour-coding to indicate if results are up to date
  • Multiple data editors can be used at the same time
  • View and edit origin-destination data for more than one junction at a time
  • A new padlock state can be used to freeze the contents of data editing screens

Analysis and Demand Set Management

  • Sets can now be renumbered and sorted by either name or ID
  • More control over which data fields should be the same in all sets and which data fields differ.  This makes it easier to avoid problems due to accidentally setting different values in each set.
  • Results for all sets are now stored
  • Analysis and demand sets within a single file can be compared

Junction Diagram Improvements

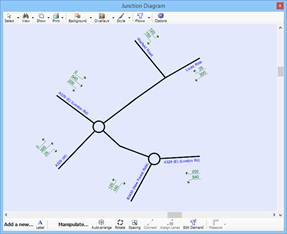
  • New Stick Diagram mode provides clean, simple diagrams that focus on traffic volumes and the overall shape of the junction
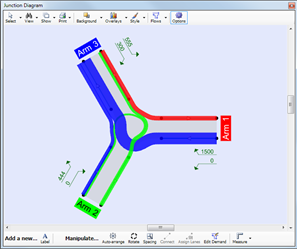
  • Enter demand data directly onto the diagram
  • Clearer text
  • Higher quality diagrams with curved connectors

ARCADY Lane Simulation

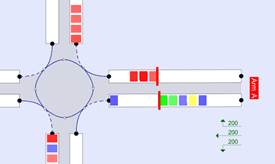
  • Lane Simulation for roundabouts, first introduced in Junctions 8, now runs faster for typical files.
  • Zebra and Pelican crossings can now be included in simulation runs
  • Blocking back on the exit side from both zebra and pelican crossings can be modelled.
  • Exit lanes carrying traffic away from junctions are now shown, and any blocking back from downstream junctions is explicitly shown here as well as on upstream entries.

PICADY Lane Simulation

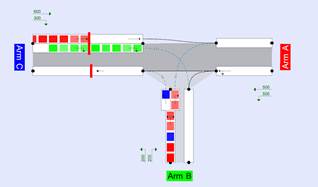
It is now possible to use Lane Simulation to model PICADY T-junctions.

The lane structure is set automatically, based on the normal PICADY junction properties.

Zebra and pelican crossings can be modelled on any arm, for all arm types.  For example, you can now model crossings at the same time as blocking, and other combinations which were previously not possible.

The visualisation and animation tools first introduced in J8 can now also be used at T-junctions.

OSCADY junctions

The OSCADY module for signalised junctions, introduced in Junctions 9.5, allows evaluation and optimisation of signals at simple isolated signalised junctions.  Signals data can be exchanged between Junctions 9.5 and TRANSYT 15.  Optionally, signalised junctions can be evaluated in Lane Simulation mode, which provides further capability such as intermittent stages and linked junctions.  Lane Simulation mode also allows the evaluation of partially signalised roundabouts and the modelling of circulating lanes at roundabouts.

Linking ARCADY, PICADY and OSCADY junctions

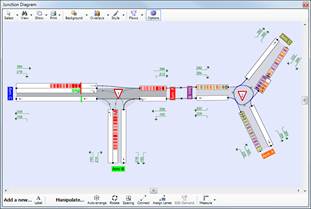
In Lane Simulation mode, ARCADY, PICADY and OSCADY junctions can be connected together.

Blocking back and basic interaction between junctions is handled.    This capability can be used to model junction layouts that were previously difficult to model, or to model small networks of ARCADY, PICADY and OSCADY components.

Queues, delays and other results are calculated for each lane individually, and combined to give arm results.

Explicitly modelling with lanes  means that it is often intuitively easier to see where or why problems occur.