TRANSYT 15.5 features a number of modelling, data and general user interface enhancements all aimed at making TRANSYT even easier to use. Graphical user interface enhancements include improvements to the network diagram, reporting system and data entry screens. Some of the enhancements are explained in more detail below:
TRANSYT 15.5 Enhancements

Modelling Enhancements
Many modelling improvements have been included in the latest release to greatly enhance the user-experience and productivity for traffic modellers including:
- Automatic network structure minimisation for greater optimisation speeds
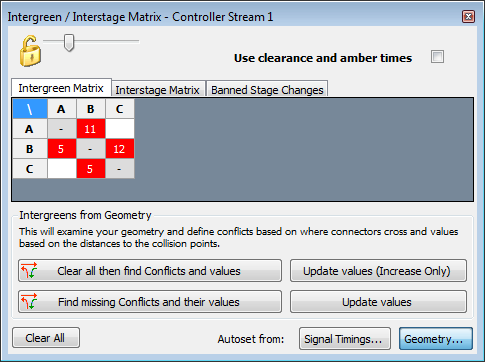
- Extended and enhanced tool for auto-calculation of vehicle-to-vehicle conflicts and intergreens now includes pedestrian-to-vehicle (and vice-versa) conflicts and intergreens. The intergreens are defined in the UK Department for Transport (DfT) Traffic Advisory Leaflet 1/06
- A new option has been included to set cell saturation flows automatically based on the number of lanes within each traffic stream
Data Handling Improvements
One of the key features of TRANSYT 15.5 is within its data-handling capabilities and those familiar with Junctions 9 will recognise some of the features that have been incorporated to greatly enhance the user-experience and productivity across the range of TRL Software traffic products.

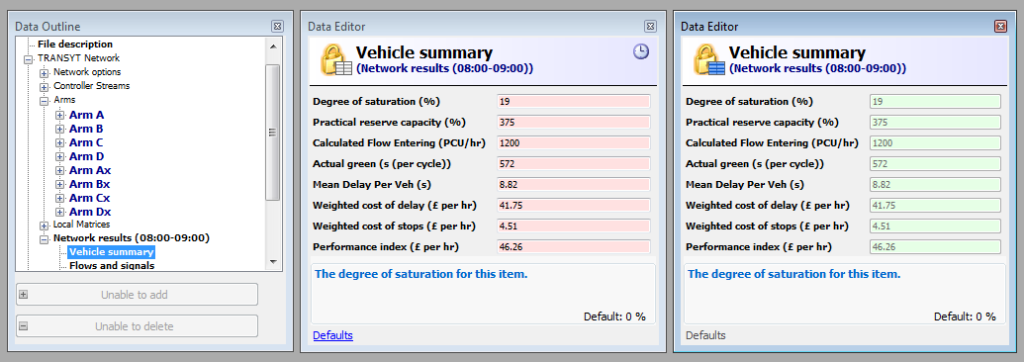
As with Junctions 9, a green background indicates results are up to date and red background indicates that the file has changed and results are no longer up to date.
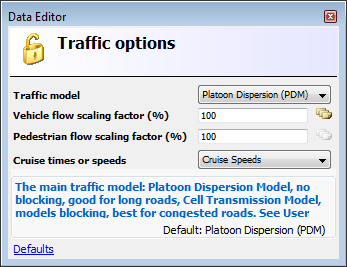
It is now possible to define individual data items across all analysis sets or a sub-set of analysis sets. The default setting is shared items across all sets until otherwise selected as different according to the modelling being carried out, potentially saving time and reducing the potential for error. The image below shows the data entry icon (to the right of the “Vehicle flow scaling factor” data field) which can be selected if wanting to redefine an item as shared.
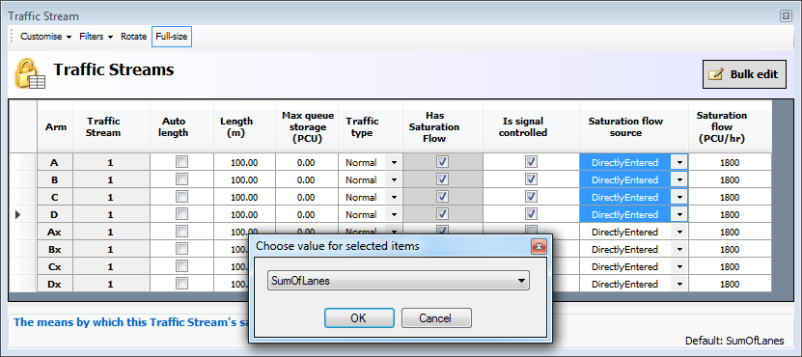
TRANSYT 15.5 sees the extension of the Data Grid system to enable users to change drop-down items and tick boxes in one go, greatly enhancing the potential for using Data Grids to view input data, output data or a combination of both.
Lane Flow Diagrams
Building on the useful lane-flow diagrams within TRANSYT, a new set of visualisation options called “Flow Overlays” are included for the network diagram which can be altered using the “Flow Overlay” options screen.
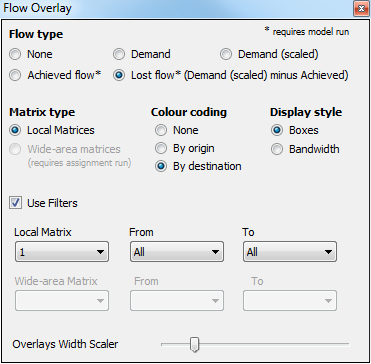
The five colour-coded lane flow types that can be displayed are:
- None
- Demand – i.e. resultant flows as seen in the file’s traffic flow OD matrices)
- Demand (scaled) – i.e. resultant flows haven taken account of the vehicle flow scaling factor
- Achieved flow – i.e. what is ultimately in the network
- Lost flow (scaled demand flow minus achieved flow)
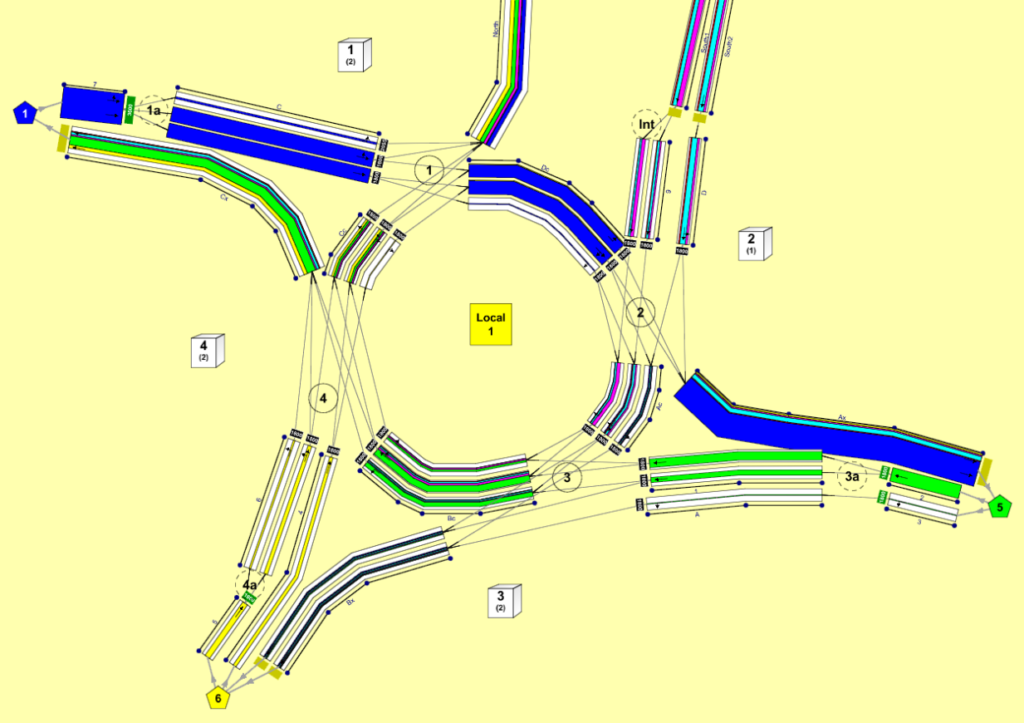
The “Display Style” offers the option of showing chosen flows in the form of a bandwidth or using a series of coloured boxes, each of which displays the flows on each lane. When using the “Bandwidth” display style, each traffic stream or link is overlaid with a yellow bar with width scaled according to the volume of flow. This makes it easy to confirm which parts of the network carry the lightest and heaviest flows (relative to each other) and it is easy to spot where traffic is being prevented from reaching parts of the network due to upstream saturation.
The following diagram illustrates options set to “By origin” with a “Bandwidth” display style, making it easier to see that the heaviest movement of traffic is from location 1 to 5.
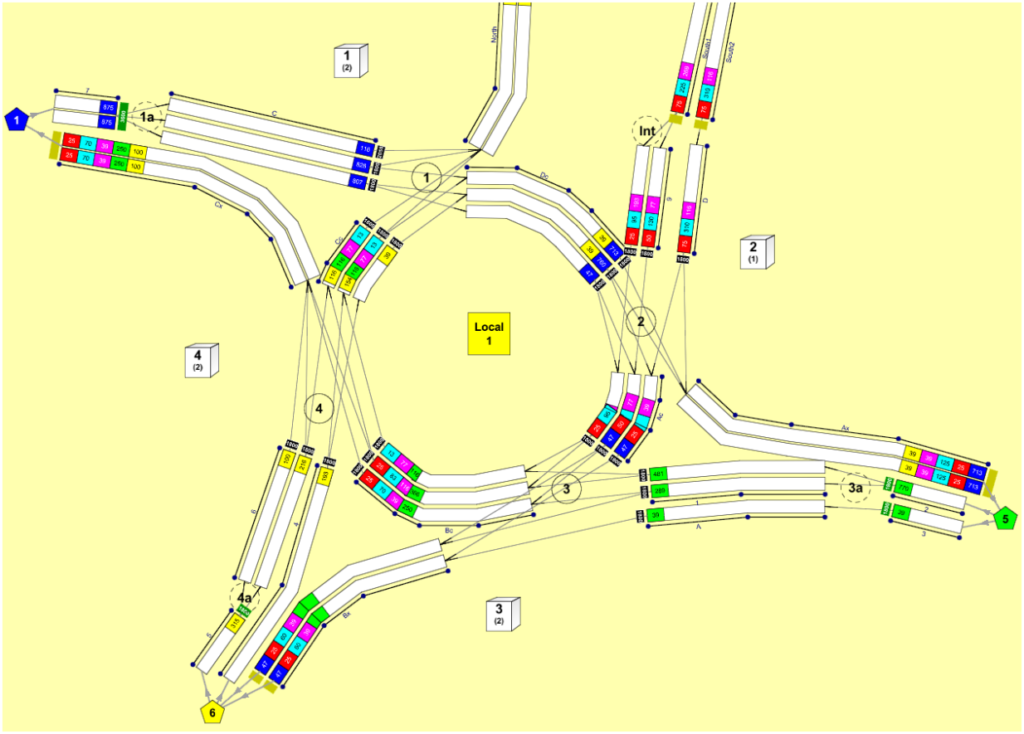
The following diagram illustrates the Demand using options “By origin” using “Boxes” display style. It is easy to see exactly which lanes are taking the flows from each origin. This view is particularly useful at the design stage of a junction because it is easier to see the effects of the number of lanes and lane movements as part of the design process.
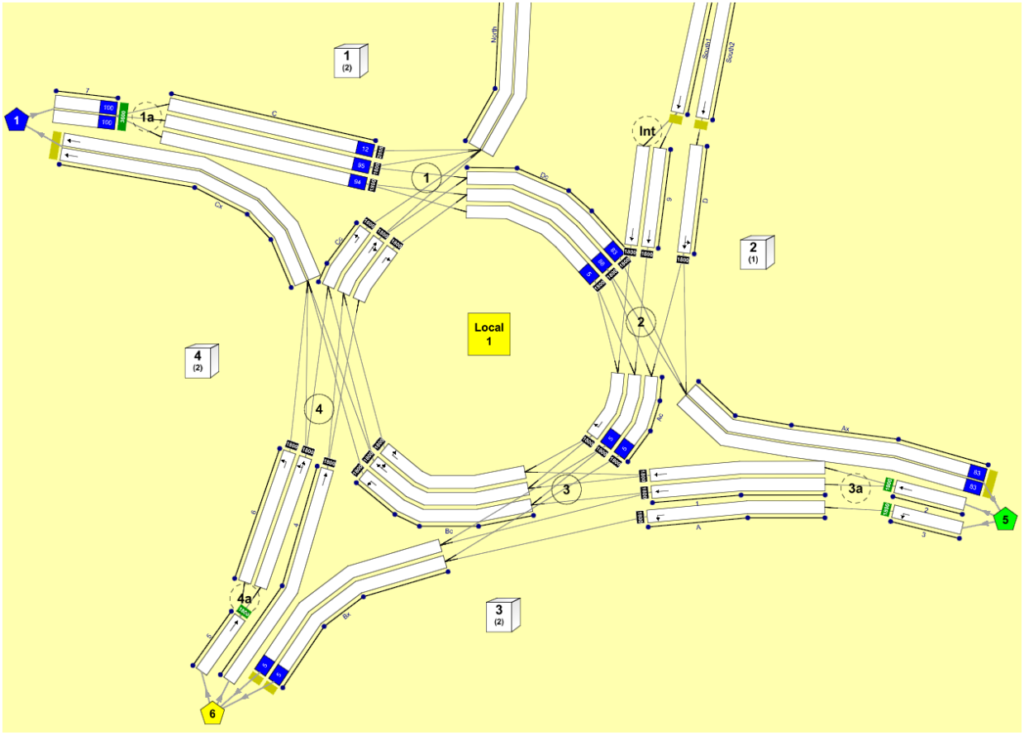
The following screenshot illustrates “Lost Flow” using options “By origin” and using “Boxes”. It is easy to identify where traffic is not progressing through the junction. The approach at location 1 is slightly over-saturated, leading to missing traffic on a number of lanes downstream.
User Interface Improvements
There are a number of improvements and enhancements that have been included within TRANSYT 15.5 to make the latest release more intuitive and accessible including a revamp of various screens and menus.
- Fully-labelled main toolbar, making it easier for new users to understand what each button does and quickly familiarise themselves with TRANSYT
- New “Exhaustive Data Outline” option to hide non-essential items making TRANSYT the ideal solution for both new and experienced traffic modellers
- Multiple monitor support for stored window layouts
- Use of traffic nodes now optional with the introduction or new default Origin/Destination settings
- New “Fast Mode” available in the Data Menu to increase TRANSYT’s interface responsiveness when working with large networks
- Enhanced copy and paste operations – parts of a data grid can now be copied from and pasted into TRANSYT
- Option of specifying image resolution for graphics copied into TRANSYT
- New “Sync” button available on the main menu forces data grids to display data related to the currently selected data item
- Reduce “working clutter” with the ability to take any window outside of the main TRANSYT screen by simple double-click of the window title bar
- Ability to now have multiple data editor windows open at the same time
- Quickly compare before and after results with the ability to “Freeze” data editor/grid contents
- Improved layout of special data-entry screens
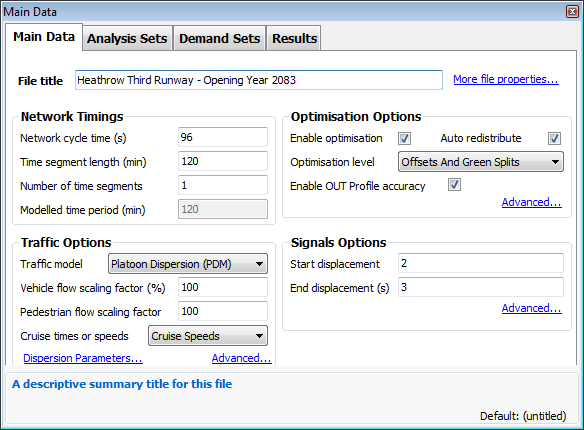
Network Diagram Visual and Functional Improvements
- TRANSYT 15.5 includes the ability to show results, overlays or animations superimposed over background images without showing the network structure, thereby enhancing the available workspace
- Direction arrows are now available for connectors
- Right-click context menu options redefined for ease-of-use, for example existing collections can now have items added and second phases can now be specified using the traffic stream context menu
- Double-clicking on a traffic stream now directs modellers to traffic stream data instead of the arm data
- Stop-lines have been improved by merging direction arrows with user arrows within each lane and automatically defining these based on assumed turning movements as used by the automatic RR67 saturation flow calculations, these can be manually overridden to allow the arrows to match conditions on the street
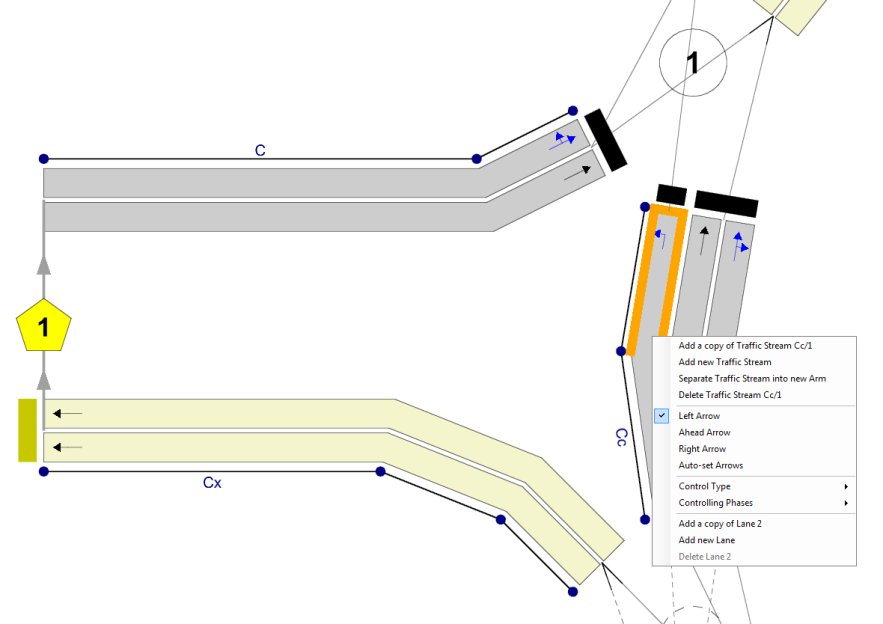
Reporting Improvements
- An enhanced file comparison system (similar to Junctions 9) not only allows for comparison between separate files, but also allows for comparison within the same file, for example when there is a requirement to compare different data sets.
- Lengths of reports can be reduced as required through the ability to “collapse” tables containing same data to a single row
- “Cyclic Flow Profile” (CFP) and “Traffic” graphs can now be added to reports in either single or double column format
- Local matrix general settings, wide-area matrix input data and results tables are now available in reports
- New configuration option enables pedestrian table suppression
Additional Diagram and Graph Improvements
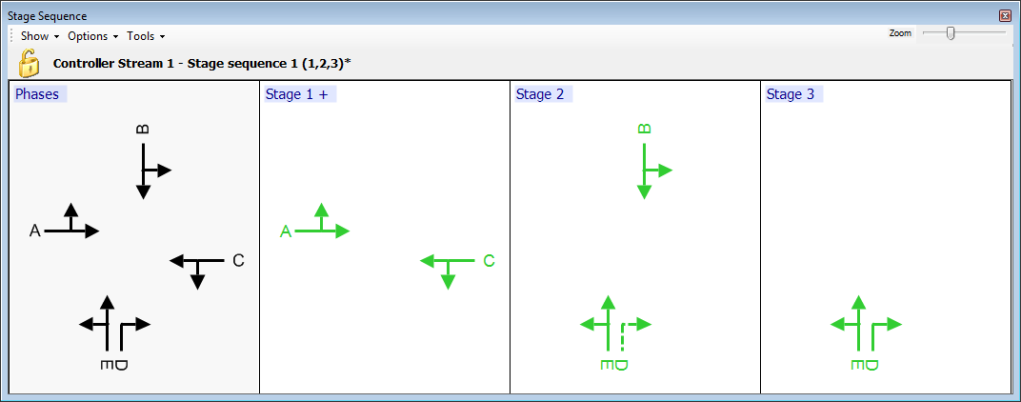
The stage sequence diagram now includes the option of a phase diagram as well as the ability to hide the stage transition diagram. Two new options are available enabling quick selection of available alternative stage sequences and set the currently displayed sequence as active. There are also some additional improvements with layout and available options.
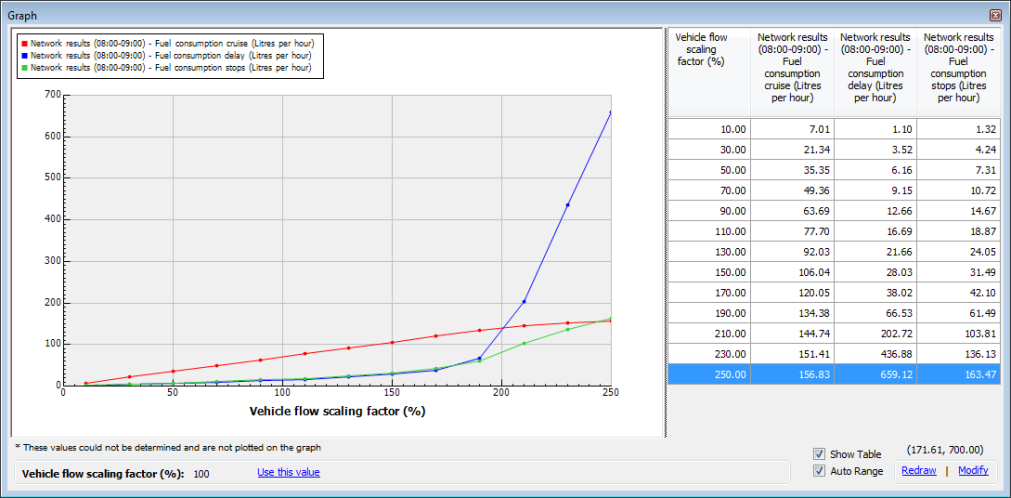
Enhancements have been provided within the Cyclic Flow Profile (CFP) graphs and “Analyser” (previously known at the “X-Y Graphs”) so it is now possible to display the full data grid of results for multiple graphs. The time distance diagram also has new option to rotate the diagram to one of four orientations.
TRANSYT can offer comprehensive and varied outputs, so please contact us if we can support you further with a specific project. We continuously invest in improving our software products and we welcome your feedback on how we can support our customers with our future releases.
Contact us for more information or to request a price quote today.