Despite increased flows, one of the approaches has an improved performance. Can this be right? - TRL Software
01344 379777software@trl.co.uk
TwitterYouTubeLinkedin
  • TRL Main Site
  • Careers
  • Publications
Top Menu
Search
Cart0
  • No products in the cart.

Subtotal: £0

View Cart Checkout

TRL SoftwareTRL Software
TRL Software
World Class Traffic & Transportation Software Solutions
  • Products
    • Junction & Signal Design
      • Junctions
        • ARCADY
        • PICADY
        • OSCADY
      • PCMOVA
      • TRANSYT
    • Traffic Control
      • MOVA
      • SCOOT®
      • Urban Traffic Control (UTC)
      • MotorGraph
    • Road Safety
      • iMAAP
      • Street Auditing
    • Economic Appraisal
      • HDM-4
    • Digital Asset Management
      • iROADS™
  • Services
    • Junction Analysis
    • Microsimulation Services
    • Signal Control
    • Road Danger Reduction
    • Software Development
    • Strategic Modelling
  • About
    • TRL Software
    • Quality Standards
    • Careers
  • News
  • Support
    • Training
    • Knowledge Base
    • Webinars
    • Videos
    • Support Options
    • Maintenance Agreement
    • Licensing
    • Online Store Help
    • Ideas Portal
    • FAQ
  • Contact
Menu back  
TRL Software > Support & Training > Articles > Despite increased flows, one of the approaches has an improved performance. Can this be right?

Despite increased flows, one of the approaches has an improved performance. Can this be right?

I am evaluating a grade-separated roundabout using ARCADY. After comparing runs for 2006 and for 2013 I am getting some results that suggests that despite increased flows in the future one of the approaches actually benefits.Can this be right?

Changes in flows can have this effect for two reasons. Firstly, changes of demand can alter the circulating flows that flow past each arm. This is because when one arm reaches saturation it will not be able to deliver any more traffic while other more lightly loaded approaches can continue to increase their contribution to the circulating carriageway. In turn, this has the effect of changing the turning proportions past each arm and can occasionally result in an improvement despite the general rise of traffic demand on each approach (see diagram). This effect is often not seen simply because the general increase of traffic will often swamp the reduction effect and all the user will see is a smaller reduction in capacity on one arm compared to the reduction on the others.
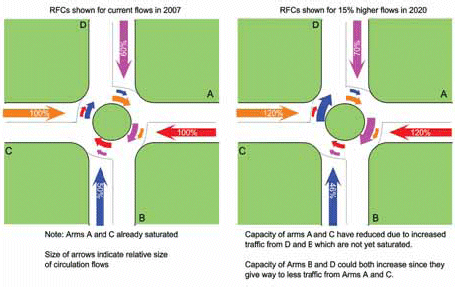
In this particular example the reason for the improvement is due to a second, entirely different, effect which is specific to large or grade-separated roundabouts. In 2013 the junction is heavily oversaturated with excessive queuing on all approaches. The flows have been scaled up for 2013 from the base year of 2006. The CIRFLO values (i.e. the mean circulating flow past each arm for thecentral 30 minutes of the modelled time period) have been calculated automatically – and here lies the problem! The initial automatic calculation of these values does NOT take account of suppressed demand and so the values used in the 2013 case are wrong. The values for this year need to be manually calculated, taking account of the suppressed demand (see Appendix H of the Application Guide AG49). The values for 2006 may also be wrong and should also be calculated in the same way. This is likely to remove the effect described, i.e. Arm A queues less in 2013 than in 2006.

Remember – Going out on-site and collecting CIRFLO data is the most accurate and robust method. When this is not possible, say, when using predicted data for future years, the calculation of CIRFLOW is a manual iterative process as described in Appendix H. For this situation, ARCADY only works out the values for the first iteration – the rest are up to you. Thankfully the number of iterative steps is usually very small.

Categories
  • ARCADY Modelling
  • ARCADY/PICADY/OSCADY Technical
  • Other products
  • PICADY Modelling
  • TRANSYT Modelling
  • TRANSYT Network Diagrams
  • TRANSYT Technical
Recent Articles

  • TRANSYT 16 Simulation Model

  • Automatically calculating future traffic flows using growth factors

  • Graphs showing sensitivity of geometric parameters

  • How can I transfer traffic data between Junctions and Excel?

  • Pedestrian crossing and blocking on the same road

Stay up to date with news from TRL Software

Sign up
Products
  • Junction & Signal Design
  • Traffic Control
  • Road Safety
  • Economic Appraisal
  • Digital Asset Management
Services
  • Junction Analysis
  • Microsimulation Services
  • Signal Control
  • Road Danger Reduction
  • Software Development
  • Strategic Modelling
Contact Us

01344 379777
software@trl.co.uk

TRL Limited
Crowthorne House
Nine Mile Ride
Wokingham
Berkshire
RG40 3GA

TRL Software
TRL Registered Office: Crowthorne House, Nine Mile Ride, Wokingham, Berks, UK, RG40 3GA. Registered in England, No. 3142272, VAT Registration 664 625 321.
© Copyright 2021 TRL. All rights reserved.
  • Sitemap
  • Terms & Conditions
  • Privacy Notice
  • Accessibility
Footer Menu