Using the Summary Results screen with Analysis Sets, Demand Sets, Scenarios and Time Periods - TRL Software
01344 379777software@trl.co.uk
TwitterYouTubeLinkedin
  • TRL Main Site
  • Careers
  • Publications
Top Menu
Search
Cart0
  • No products in the cart.

Subtotal: £0

View Cart Checkout

TRL SoftwareTRL Software
TRL Software
World Class Traffic & Transportation Software Solutions
  • Products
    • Junction & Signal Design
      • Junctions
        • ARCADY
        • PICADY
        • OSCADY
      • PCMOVA
      • TRANSYT
    • Traffic Control
      • MOVA
      • SCOOT®
      • Urban Traffic Control (UTC)
      • MotorGraph
    • Road Safety
      • iMAAP
      • Street Auditing
    • Economic Appraisal
      • HDM-4
    • Digital Asset Management
      • iROADS
  • Services
    • Junction Analysis
    • Microsimulation Services
    • Signal Control
    • Road Safety
    • Software Development
    • Strategic Modelling
  • About
    • TRL Software
    • Quality Standards
    • Careers
  • News
  • Support
    • Training
    • Knowledge Base
    • Webinars
    • Videos
    • Support Options
    • Maintenance Agreement
    • Licensing
    • Online Store Help
    • Ideas Portal
    • FAQ
  • Contact
Menu back  
TRL Software > Support & Training > Articles > Using the Summary Results screen with Analysis Sets, Demand Sets, Scenarios and Time Periods

Using the Summary Results screen with Analysis Sets, Demand Sets, Scenarios and Time Periods

Why does the Summary Results screen only show one set of outputs?
Why does the Summary Results screen have lots of blank sections?

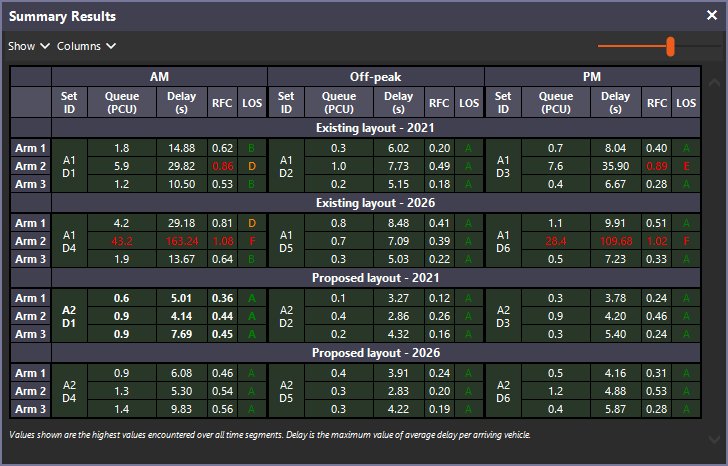
By default, this screen only shows the results for the currently selected Analysis and Demand Set pair.  To shows results for all sets, click Mode>Show All Analysis and Demand Sets from within the Summary Results screen.  Note that this option is saved as a user preference rather than in the file.

The Summary Results screen automatically lays out rows and columns according to your naming of Analysis and Demand sets.  Different Analysis Sets (e.g. existing/proposed layouts) form different sections.  The Time Period Names of Demand Sets (e.g. AM/Off-peak/PM) form the columns.  Finally the Scenario Names of Demand Sets (e.g. 2021, 2026) form rows.

There is nothing to stop you using the Scenario Name to fully describe the Demand Set (e.g.  ‘2021 Off-peak’) but you may then find that the Summary Results screen shows a large grid that is mostly empty, because the program wouldn’t know how to separate the time period from the year and other information.  In this case it would be better to separate the ‘2009’ and the ‘Off-peak’ into the Time Period Name and the Scenario Name respectively.

For full details, please see the Junctions User Guide, which lays out a variety of examples.

Categories
  • ARCADY Modelling
  • ARCADY/PICADY/OSCADY Technical
  • Other products
  • PICADY Modelling
  • TRANSYT Modelling
  • TRANSYT Network Diagrams
  • TRANSYT Technical
Recent Articles

  • TRANSYT 16 Simulation Model

  • Automatically calculating future traffic flows using growth factors

  • Graphs showing sensitivity of geometric parameters

  • How can I transfer traffic data between Junctions and Excel?

  • Pedestrian crossing and blocking on the same road

Stay up to date with news from TRL Software

Sign up
Products
  • Junction & Signal Design
  • Traffic Control
  • Road Safety
  • Economic Appraisal
  • Digital Asset Management
Services
  • Junction Analysis
  • Microsimulation Services
  • Signal Control
  • Road Safety
  • Software Development
  • Strategic Modelling
Contact Us

01344 379777
software@trl.co.uk

TRL Limited
Crowthorne House
Nine Mile Ride
Wokingham
Berkshire
RG40 3GA

TRL Software
TRL Registered Office: Crowthorne House, Nine Mile Ride, Wokingham, Berks, UK, RG40 3GA. Registered in England, No. 3142272, VAT Registration 664 625 321.
© Copyright 2021 TRL. All rights reserved.
  • Sitemap
  • Terms & Conditions
  • Privacy Notice
  • Accessibility
Footer Menu