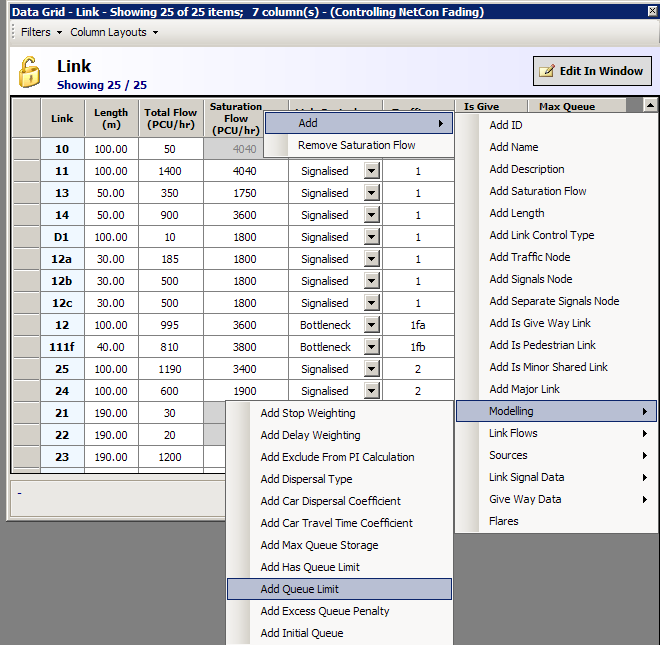
Yes! You can do this in all versions since TRANSYT 13 – Rather than create custom tables within the report itself, you need to use the Data Grid. Open the grid you want and then simply right-click on the any of the grey headers to add or remove any columns in the table (see Image1 below).

Image 1 – Design your own table
N.B. Any Data Grid can be edited, but if you wish to be able to select all link data related items you need to first ensure the heading is LINK (as shown above), e.g. if you have highlighted a subset of “Link” such as ”Modelling” you will only be able to add or remove items associated with link “Modelling”. The mixing of input data and output results is also possible.
Having added or deleted the columns to your liking, you need to select the menu item “Column Layouts/Store Current Column Layouts” (see example below) in order to store the image. You can now use the menu item “Manage Stored Column Layouts” to set the “UseInReports” flag. From now on your beautifully crafted table will appear in all subsequent reports (see Image 3 below).
Image 2 – Store your design and add to the report
 Image 3 – Your new table within the Report
An alternative quick way to create your own table is to start from scratch by firstly using the Column Layouts option “Remove All columns”. Then populate your table using the “Add columns from Data Editor” to select each column one-by-one, simply by clicking on the Data Editor items you wish to add.
