Introduction
TRANSYT is a tool for the evaluation of traffic network performance for a given set of traffic demands, road conditions and signal settings. The evaluation results may then be used for signal optimisation and/or for road scheme assessments.
At the core of TRANSYT are different types of traffic models, including a platoon dispersion model (PDM) and its variants, a ‘congested’ platoon dispersion model (CPDM), and a Cell Transmission Model (CTM).
TRANSYT 16 introduces a new type of model, known simply as TRANSYT Simulation, which uses a simulation technique to model traffic. This provides a way to get the benefits of microsimulation, with fast runtimes and without the need for complex modelling or the costs usually associated with producing microsimulation models. Existing TRANSYT users can benefit without the need to create new models – in the vast majority of cases, existing models can be used without any modification.
Traditional TRANSYT traffic models
The traditional traffic models in TRANSYT are macroscopic models, meaning that they deal with aggregate flows of traffic rather than individual vehicles. For example, at a given time, the model may know that the quantity of traffic emerging from a certain road is 500 vehicles per hour, and the traffic entering another road is 200 vehicles per hour. These aggregate flows interact with each other and form the basis of the traffic model. Representing traffic in this way makes the models computationally efficient, albeit at the expense of them being unable to model individual vehicle behaviour and interactions. It is not possible, for instance, for the model to know where in the network a particular vehicle is at a given time.
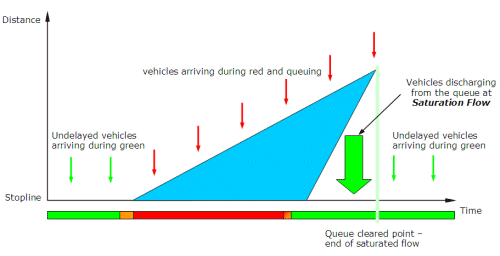
The macroscopic TRANSYT models also assume that traffic behaviour is cyclic, based on a common signal cycle time for the network. The network must operate using fixed-time signal control (although TRANSYT does allow for multiple cycling and different cycles for different subnetworks). With this cyclic assumption, the traffic model is run only up to the point when traffic has settled to a cyclic state, with most model results being based on averages over the cycle. This provides an indication of average performance over the modelled period. If the network is under-saturated, then the behaviour in a given signal cycle repeats over and over, so that the last cycle in the modelled time period (e.g. one hour) is essentially the same as that of the first cycle. If the network is oversaturated, with queue and delay increasing over time, this is estimated by TRANSYT but not modelled in detail.
Simulation model in TRANSYT 16
In TRANSYT 16, a Simulation Model is available. In this model, individual vehicles are simulated, and so the model is closer to a microscopic model. However, the TRANSYT Simulation differs from conventional microscopic simulations such as Vissim or Aimsun in that it uses a simplified representation of vehicle movements on the road. Detailed behaviour such as car-following, acceleration and gap-accepting are not modelled. Instead, TRANSYT Simulation is mainly concerned with queueing behaviour and travel time along road links while taking into account traffic demand and available road capacities. This capability facilitates the modelling of blocking back and other effects whilst remaining relatively computationally efficient, and reducing time to produce representative, and accurate models.
In the TRANSYT Simulation model, the cyclic assumption described previously is not relevant. The TRANSYT Simulation model runs explicitly for the entire modelled period, allowing the network performance to be examined in detail at any point in time. This feature is useful for the investigation of congestion caused by blocking back effects which propagate backwards quickly (average model results would not be very helpful here). Unlike the existing TRANSYT models, the TRANSYT Simulation model can simulate accurately the full effect of controller streams operating on different cycle times. It is also useful for modelling demand-dependent scenarios using intermittent stages. A particular stage may be set either to run every N cycles (e.g., to mimic bus priority systems), or to run on a given probability to mimic pedestrian crossings triggered by random arrival of pedestrians.
In TRANSYT Simulation the “resultant” signal timings data and vehicle positions are logged during the simulation run and are available for the user to inspect in for the form of animations and diagrams.
Random arrivals of vehicles at the boundary of the network (i.e. entry links) and on give-way links are modelled in a more explicit way than the traditional TRANSYT models. This means that random brief bursts of vehicle arrivals or departures are modelled, plus their effects on upstream/downstream links. This behaviour can be seen by the user by carefully watching the simulation animations.
The TRANSYT Simulation can model situations which are not possible using the existing TRANSYT traffic models, such as complex flare situations. Of the traditional models, the CPDM model has an additional ‘blocking’ capability as well as modelling blocking back in general, which handles namely the randomness in blocking in flared situations. However, this functionality may be applied only to specific flare structure: one PDM link feeding two or three signal controlled PDM links that are shorter than 30 meters. For more general flared cases, either CTM or TRANSYT Simulation can be used, bearing in mind that the CTM does not allow for randomness in blocking whereas TRANSYT Simulation does.
The TRANSYT Simulation does not currently model platoon dispersion. However, when blocking back effects need to be modelled these will also be the very situations where modelling of dispersion will be less important. When the network involves both short and long links, mixed PDM / CTM / CPDM should be used. On the other hand, when it is desirable to study the behaviour of an oversaturated network, the TRANSYT Simulation is ideal, because it models the whole modelled time period – not just an average single cycle.
Using the Simulation Mode in TRANSYT 16
A TRANSYT Simulation model has very few parameters to define in addition to those already in a TRANSYT model. Generally speaking, any existing TRANSYT network data file can be run in TRANSYT Simulation mode without making any changes. All that is necessary is to turn on ‘Use Simulation’ for the relevant Analysis Set, or to click on the ‘Simulation’ button on the main toolbar.
Note however that Simulation mode is only available for networks that use traffic streams, and not for link-based networks, and that certain network features may be ignored or not modelled in Simulation mode.
One important feature of TRANSYT Simulation is its balance between model performance and complexity. Because it is not a full microsimulation, it typically runs quickly. When the simulation is started, a random seed is used to trigger the process of vehicle generation and a single “trial” of the simulation is run, covering the modelled period of, say, 08:00-09:00. Run times depend on the network size and complexity and the number of vehicles in the network, but a single trial will typically take less than a second. The results from a single trial are usually enough to reveal the approximate network behaviour and for the network animations to show visually how vehicles progress through the network or where there are inefficiencies in the network. Running a second trial will show similar results but there will be some differences due to using a different random seed. Usually, therefore, several trials are run, each using a different random seed, and the results from these trials averaged together. By default this continues until the results are considered to have “converged” but the process can be stopped at any time by the user, including after a single trial. Typically, signalised links are more deterministic and so will tend to converge faster than give-way links or other regions where randomness is an important factor.
Examples
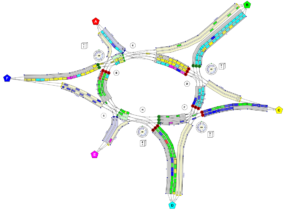
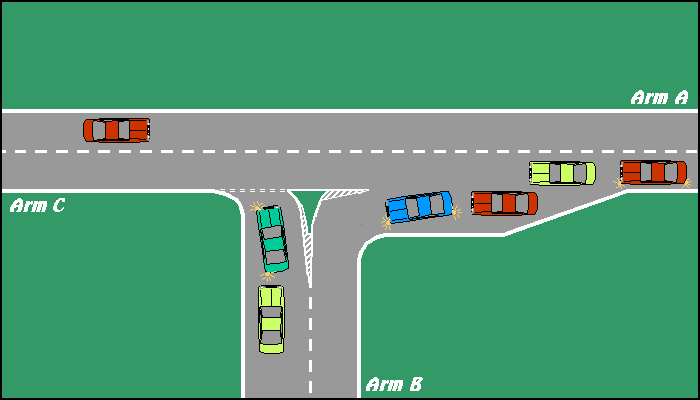
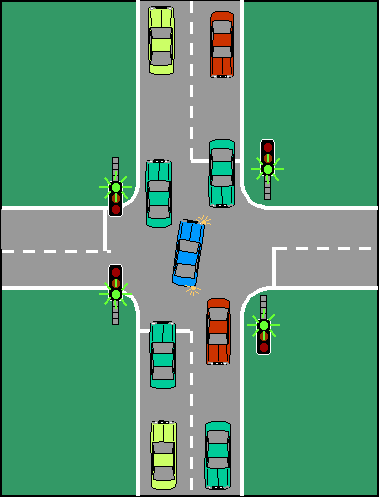
Shown below is a snapshot from the individual vehicle animation available after running a TRANSYT Simulation model for a signalised roundabout. Each coloured block represents a vehicle, with the colours signifying the vehicle destinations (coloured locations at the edge of the network). The animation shows both queued vehicles waiting at stop lines, and also a representation of vehicles moving at their cruise speed along links and connectors.
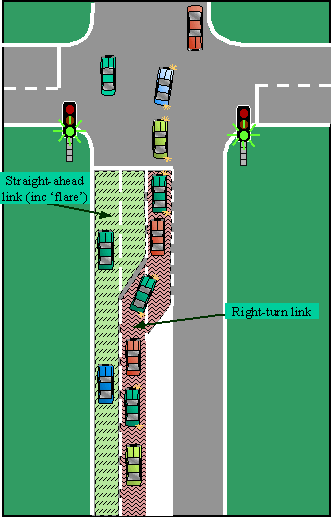
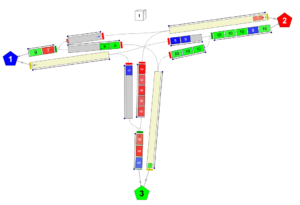
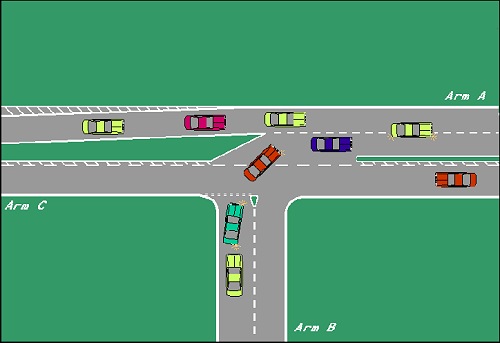
The animation snapshot below shows examples of blocking and lane starvation. The vehicles are colour-coded by destination, and also show the path ID assigned to each vehicle. On the southern arm, there is a blue vehicle in the upstream queue but it cannot enter the appropriate downstream lane because it is blocked by queueing red vehicles in front. (In this example, the turning proportions are such that most vehicles turn right, headed to Location 2). Due to this, the lane for left-turners on the southern arm is mostly empty and under-utilised. The simulation results and animations will help to reveal whether this is an occasional occurrence or whether it happens regularly.
Similarly, on the eastern arm, the blue vehicle in the upstream lane, waiting to travel straight-ahead to Location 1, won’t be able to enter its lane until the green left-turning vehicles have cleared.
The traditional TRANSYT models would model these effects to some extent but the additional visualisation tools that simulation provides makes it much easier to see graphically what is happening and to get more reliable results about “where” the queues are. If the situation is more complicated, with the blocking being transmitted to further upstream links, then TRANSYT Simulation will model this without any modification whereas the traditional models may require some thought.


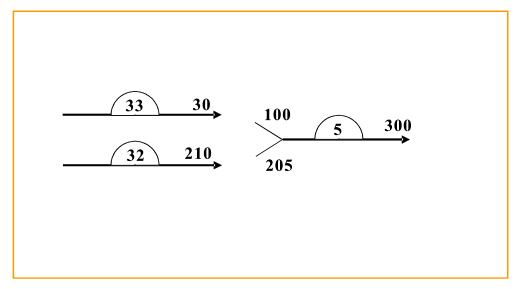
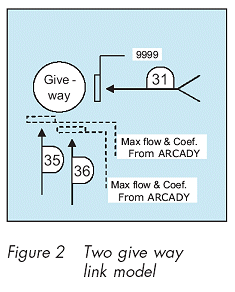 As can be seen, the differences between the two models are quite marked with the two-link model significantly worse in delay terms. It should be noted, however, that these two models probably are not directly equivalent after all. In this single link example, all lanes are equally used with queues being nearly equal. In the above two-link model, the average queue will be the same for both lanes, but the randomness of arrivals will mean that the links will ‘take it in turns’ to have the longer queue. Such unequal queueing is likely if lanes are used for different destinations, in which case the more pessimistic two-link model may be more appropriate. A single link model will be appropriate when adjacent lanes share a common movement so giving the opportunity for drivers to choose between two or more lanes. When using a two link model it will be necessary to derive the maximum flow and give-way coefficients using ARCADY by, in effect, modelling the two parts on an approach as separate entries. This will give the two sets of parameters required.
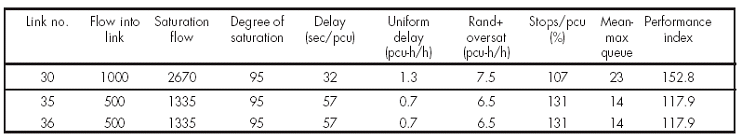
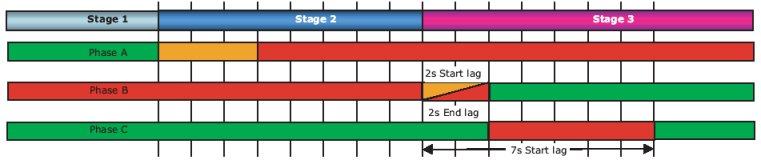
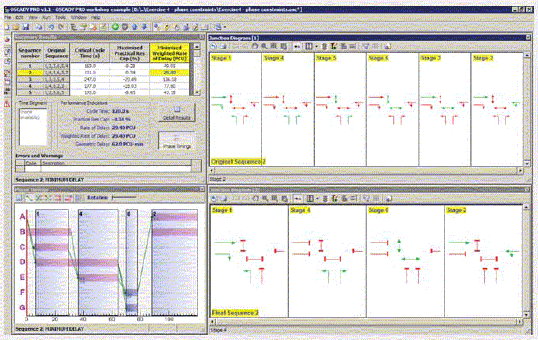
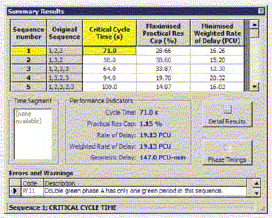
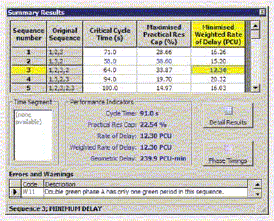
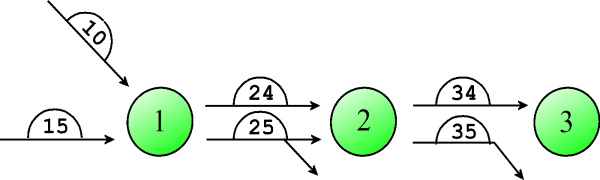
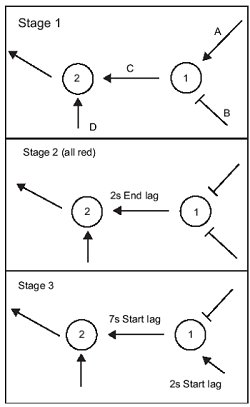 Figure 1 - Stage sequence