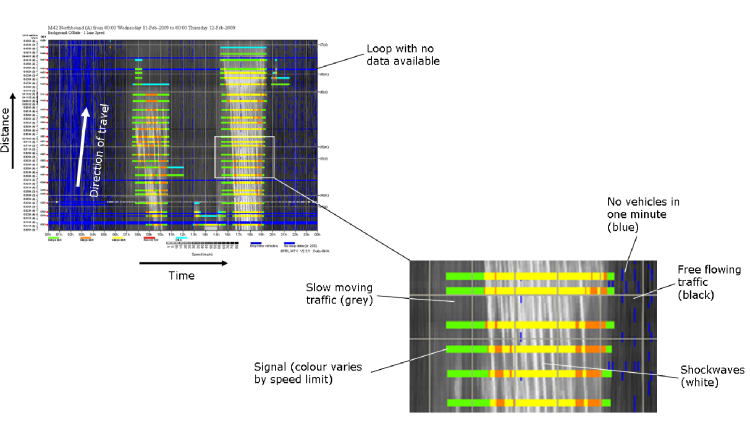
MotorGraph is a near real-time web-based tool for visualising motorway events, congestion and traffic. MotorGraph provides the data in plot format, making it possible to quickly absorb and interpret a vast amount of information about current traffic conditions and signal settings.
MotorGraph

MotorGraph has been developed by TRL to provide managers and operators with timely and relevant information about the network. The technologies used to aid efficient operation of the road network include the Motorway Incident Detection and Automatic Signalling (MIDAS) system and Managed Motorways. MotorGraph is a key tool in assessing the performance of these systems.
How it works
Two types of rolling 24-hour plots are available through the web portal – one showing traffic speeds and signal data and one showing Variable Message Sign (VMS) data – enabling the user to obtain a complete picture of what is occurring on a motorway stretch. MotorGraph also has an archive of older plots.
MotorGraph provides plots for all major stretches of motorway across England that have traffic detection and signalling installed. This unique facility provides all available real-time and historic data in one place, allowing users to access and interpret information about all systems on instrumented motorways.
How is MotorGraph used?
MotorGraph enables near real-time assessment and validation of signal settings and traffic conditions. Previously, systems such as Managed Motorways were reviewed manually once historical traffic and signal data became available. As a result, it could take several days to identify and investigate problems, with inappropriate settings potentially being displayed for long periods.
The live and historic information provided by MotorGraph allows licenced users to assess and track operational performance of control systems on motorways; monitor live and historic traffic patterns; optimise traffic control systems and identify sources and causes of congestion.
MotorGraph can also be used to identify or assess:
- Reasons behind any signal setting or slow traffic
- Compliance with red crosses
- Rogue use of the hard shoulder
- Effectiveness of ramp metering
- Unusual situations where the signals do not match the traffic conditions (enabling a rapid response to rectify any fault); and
- Unusual congestion patterns
By analysing the data provided by MotorGraph, users can be sure that any signalling is consistent, coherent and appropriate for the traffic conditions and therefore, traffic systems are operating optimally.
Case Studies
Birmingham Box plot
A MotorGraph plot is produced everyday that shows the “Birmingham Box” (M42, M6, M5) in both directions as a single stretch of road. This enables area managers to assess the “box” in its entirety and to gain an understanding of how interacting congestion affects the whole area.
Spurious HIOCC (High Occupancy) assessment
MotorGraph plots are used to spot queue protection signals displayed for short periods that do not appear appropriate to traffic conditions. These signals can cause drivers to brake sharply or lose confidence in the settings. The underlying patterns in such signals (which can occur many times a day) would not normally be picked up because they are on for such short periods of time. Using MotorGraph to spot these signals early has resulted in a significant reduction in instances of spurious HIOCC, thereby ensuring greater driver confidence and safety.
Sample Plot

Licences
A MotorGraph licence grants users access to specific regions of the road network via the web portal. To obtain a licence or to find out more how MotorGraph could help you, please use the contact details on this page.