How/why was the 10m setback distance decided upon and can a shorter setback distance can be used for visibility input? - TRL Software
01344 379777software@trl.co.uk
TwitterYouTubeLinkedin
  • TRL Main Site
  • Careers
  • Publications
Top Menu
Search
Cart0
  • No products in the cart.

Subtotal: £0

View Cart Checkout

TRL SoftwareTRL Software
TRL Software
World Class Traffic & Transportation Software Solutions
  • Products
    • Junction & Signal Design
      • Junctions
        • ARCADY
        • PICADY
        • OSCADY
      • PCMOVA
      • TRANSYT
    • Traffic Control
      • MOVA
      • SCOOT®
      • Urban Traffic Control (UTC)
      • MotorGraph
    • Road Safety
      • iMAAP
      • Street Auditing
    • Economic Appraisal
      • HDM-4
    • Digital Asset Management
      • iROADS™
  • Services
    • Junction Analysis
    • Microsimulation Services
    • Signal Control
    • Road Danger Reduction
    • Software Development
    • Strategic Modelling
  • About
    • TRL Software
    • Quality Standards
    • Careers
  • News
  • Support
    • Training
    • Knowledge Base
    • Webinars
    • Videos
    • Support Options
    • Maintenance Agreement
    • Licensing
    • Online Store Help
    • Ideas Portal
    • FAQ
  • Contact
Menu back  
TRL Software > Support & Training > Articles > How/why was the 10m setback distance decided upon and can a shorter setback distance can be used for visibility input?

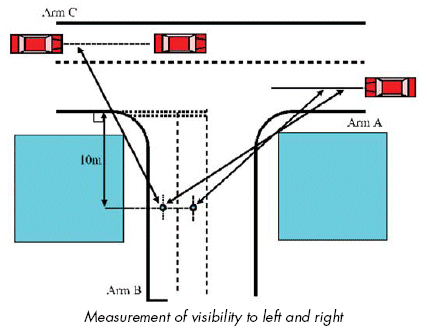
How/why was the 10m setback distance decided upon and can a shorter setback distance can be used for visibility input?

The 10 metre visibility position comes from the original regression analysis carried out by TRL. In the original study the measurement of visibility was measured from a number of different points. The measurement of 10 metres was found during the analysis to provide the strongest link between it and the capacity.

Unfortunately this does not match up with the values that most traffic engineers will have. There is unfortunately no possible way to translate this value so that it represents the visibility from another point as it depends on the proximity of the obstructions that make the parameters the value it is. You can use, say, a scale diagram but it is always best to do measurements on-site if possible so that ALL obstacles that are present during the time period you are interested in are taken account of. E.g. high-sided vehicles parked throughout the modelled time in such a way to reduce visibility should be taken account of, if you wish to gain accurate results.
Categories
  • ARCADY Modelling
  • ARCADY/PICADY/OSCADY Technical
  • Other products
  • PICADY Modelling
  • TRANSYT Modelling
  • TRANSYT Network Diagrams
  • TRANSYT Technical
Recent Articles

  • TRANSYT 16 Simulation Model

  • Automatically calculating future traffic flows using growth factors

  • Graphs showing sensitivity of geometric parameters

  • How can I transfer traffic data between Junctions and Excel?

  • Pedestrian crossing and blocking on the same road

Stay up to date with news from TRL Software

Sign up
Products
  • Junction & Signal Design
  • Traffic Control
  • Road Safety
  • Economic Appraisal
  • Digital Asset Management
Services
  • Junction Analysis
  • Microsimulation Services
  • Signal Control
  • Road Danger Reduction
  • Software Development
  • Strategic Modelling
Contact Us

01344 379777
software@trl.co.uk

TRL Limited
Crowthorne House
Nine Mile Ride
Wokingham
Berkshire
RG40 3GA

TRL Software
TRL Registered Office: Crowthorne House, Nine Mile Ride, Wokingham, Berks, UK, RG40 3GA. Registered in England, No. 3142272, VAT Registration 664 625 321.
© Copyright 2021 TRL. All rights reserved.
  • Sitemap
  • Terms & Conditions
  • Privacy Notice
  • Accessibility
Footer Menu